

Canadian ceramic tile market was almost stable in 2022
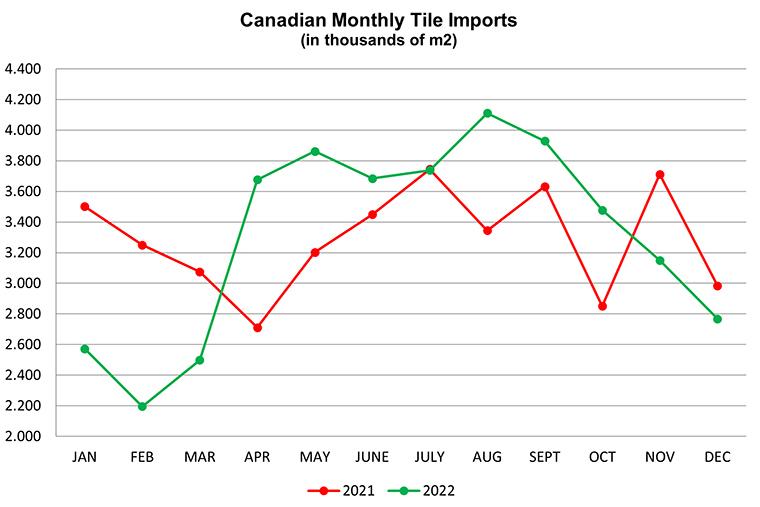
Canadian ceramic tile consumption last year was 39.6 million m2, up just 0.5% from 2021.
According to figures from Statistics Canada, Canadian ceramic tile consumption last year was 39.6 million m2 (426.7 million sq. ft.), up just 0.5% from 2021. As there is no significant ceramic tile production in Canada, imports approximately equal consumption.
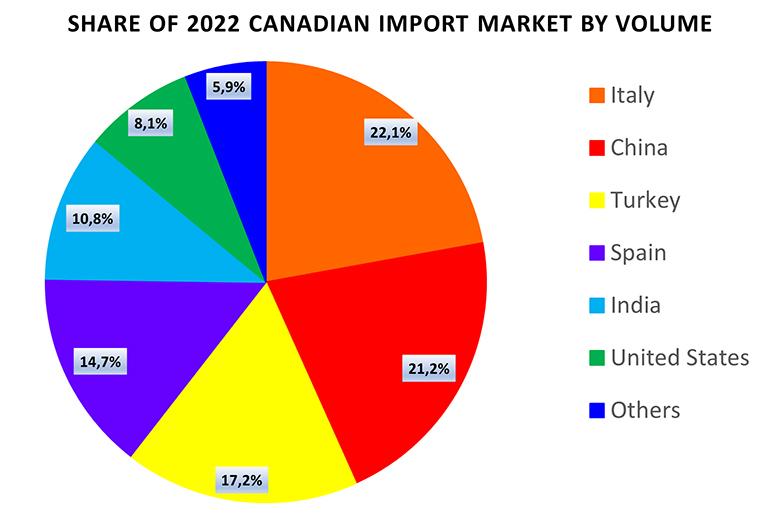
The five countries from which the most tiles were imported into Canada in 2022 based on volume were:
| Country | M2 2022 | M2 2021 | % Change |
|---|---|---|---|
| Italy | 8,777,636 | 9,347,578 | -6.1% |
| China | 8,387,039 | 10,105,093 | -17.0% |
| Turkey | 6,824,275 | 6,414,027 | 6.4% |
| Spain | 5,832,699 | 4,892,821 | 19.2% |
| India | 4,276,747 | 3,822,234 | 11.9% |
| All Countries | 39,640,242 | 39,440,242 | 0.5% |
The five countries from which the most tiles were imported in 2022 based on total Canadian $ value were:
| Country | Total C$ Val 2022 |
Total C$ Val 2021 |
% Change |
|---|---|---|---|
| Italy | 188,077,864 | 176,308,944 | 6.7% |
| China | 69,639,689 | 75,651,290 | -7.9% |
| Spain | 66,335,525 | 61,289,008 | 8.2% |
| Turkey | 58,708,085 | 42,809,713 | 37.1% |
| United States | 40,666,309 | 28,300,312 | 43.7% |
| All Countries | 479,481,151 | 429,860,953 | 11.5% |
Canadian imports are valued FOB place of direct shipment to Canada. The import valuation excludes costs of freight and insurance in bringing the goods to Canada from the point of direct shipment.
Did you find this article useful?
Join the CWW community to receive the most important news from the global ceramic industry every two weeks


Recent articles


Ceramic World Review 167/2026

Powtech Technopharm 2026


Main topics

Read more