
The Italian sanitaryware, tableware, refractory and brick industries
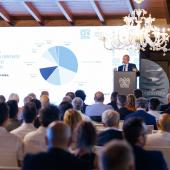
Along with the results for the ceramic tile sector, Confindustria Ceramica also presented the 2022 results for Italian producers of sanitaryware, tableware, refractory materials and heavyclay bricks.
Along with the results for the ceramic tile sector, Confindustria Ceramica also presented the 2022 results for Italian producers of sanitaryware, tableware and porcelain, refractory materials and bricks and roof tiles, during its annual meeting in June.
The Italian ceramic sanitaryware sector (30 companies, including 27 located in the Civita Castellana cluster in the province of Viterbo, with 2,652 direct employers) produced 3.6 million pieces, generating revenues of €397 million (+7.6% on 2021), 40% of which came from exports (€156.8 million).
Refractory material production decreased to a volume of 301,000 tonnes and revenues of €373 million (-2%). This included €151 million from Italian domestic sales and more than €222 million from exports. The Italian refractory materials industry consists of 30 companies with a workforce of 1,639 employees.
Italian brick and roof tile production picked up again in 2022 to 4.5 million tonnes of products (+2.2%). The 62 companies in the sector (with a workforce of 3,000 people) generated revenues of €700 million (up from €500 million in 2021), mostly in the Italian market.
Finally, the 9 companies making up the Italian ceramic tableware industry registered a fall in both production (9,900 tonnes) and sales (9,400 tonnes). Domestic sales accounted for 75% of the total. The 2022 turnover totalled €60.1 million (+27% on 2021), about 63% of which was generated in Italy.
| 2018 | 2019 | 2020 | 2021 | 2022 | |
|---|---|---|---|---|---|
| Companies / Aziende | 30 | 30 | 30 | 30 | 30 |
| Employees / Addetti | 2,743 | 2,672 | 2,652 | 2,663 | 2,652 |
| Production / Produzione (mill. pieces) | 3.9 | 4.0 | 3.1 | 4.0 | 3.6 |
| Total Turnover (mill.€) / Fatturato Totale * | 336.4 | 338.8 | 306.2 | 368.8 | 396.9 |
| - Domestic sales / Vendite domestiche* | 185.0 | 186.3 | 168.4 | 202.4 | 240.1 |
| - Exports* | 151.4 | 152.5 | 137.8 | 166.4 | 156.8 |
| 2018 | 2019 | 2020 | 2021 | 2022 | |
|---|---|---|---|---|---|
| Companies / Aziende | 10 | 10 | 9 | 9 | 9 |
| Employees / Addetti | 668 | 655 | 644 | 649 | 654 |
| Production / Produzione (ton x 000) | 13.2 | 11.6 | 8.4 | 10.6 | 9.9 |
| Total sales / Vendite Totali (ton x 000) | 12.8 | 10.0 | 7.8 | 9.9 | 9.4 |
| Total Turnover (mill.€) / Fatturato Totale | 54.9 | 49.7 | 32.8 | 47.2 | 60.1 |
Did you find this article useful?
Join the CWW community to receive the most important news from the global ceramic industry every two weeks


Related articles


Recent articles

Sirsi Valves accelerates its growth


Bruno Bettelli elected President of ACIMAC

Main topics
Read more